Compute the tracing score of a contact
This function compute the tracing score of a contact, i.e. an individual who has had at least one recorded exposure to a case. For a contact, the tracing score is defined as the probability that this individual will show symptoms for the first time on day 't'.
contact_score(x, R, lambda, w)
Arguments
- x
- A vector of integers indicating dates of onset of the cases causing exposure.
- R
- The average effective reproduction number, i.e. the average number of secondar cases seeded by an infected individual.
- lambda
- The average number of contacts (infectious or not) reported by cases.
- w
- The probability mass function of the serial interval, i.e. the delay
from primary to secondary symptom onset. We recommend using the
distcretepackage to generate discretized distributions (see details).
Value
A function with two arguments:
-
t: the date for which the score should be computed. -
visit_days_ago: the number of days since the last visit to the contact, defaulting to1, which means that the last visit happened the day beforet.
Details
See the distcrete package for generating discretized
distributions at: http://github.com/reconhub/distcrete.
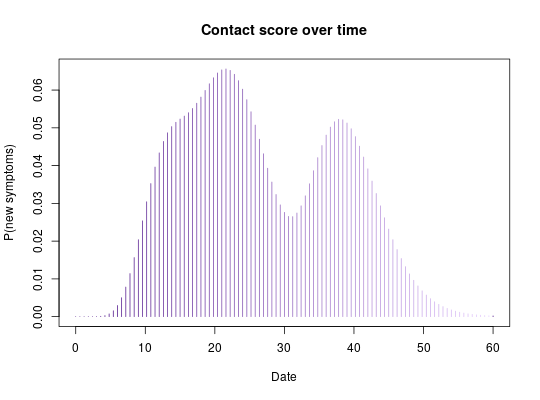
Examples
if (require(distcrete)) {
 ## generate serial interval distribution
 SI <- distcrete("gamma", 1L, w = 0, 10, 0.65)$d
 plot(SI, type="h", xlim=c(0,50), xlab = "Days")
 title("Serial interval distribution")

 ## get tracing score function for:
 ## - exposure to cases with onsets: 1, 10, 25
 ## - R = 2.1
 ## - lambda = 3.5
 f <- contact_score(c(1,10,25), R = 2.1, lambda = 3.5, SI)

 ## score for various days
 f(0) # day 0
 f(10) # day 10
 f(10:20)

 ## plot score for various days
 plot(f, type = "h", xlim = c(0,60), col = pal1(100),
      xlab = "Date", ylab = "P(new symptoms)")
 title("Contact score over time")
}