Compute the tracing score of a group of contacts
This function compute the tracing score of a group of contacts, i.e. a set of individual who have been exposed to one or several cases whose dates of onsets are known. The tracing score is defined as the expected number of individuals that will show symptoms for the first time on day 't'.
group_score(x, R, lambda, w)
Arguments
- x
- A list of integer vectors indicating dates of onset of the cases causing exposure. Each item of the list corresponds to a different individual.
- R
- The average effective reproduction number, i.e. the average number of secondar cases seeded by an infected individual.
- lambda
- The average number of contacts (infectious or not) reported by cases.
- w
- The probability mass function of the serial interval, i.e. the delay
from primary to secondary symptom onset. We recommend using the
distcretepackage to generate discretized distributions (see details).
Value
A function with two arguments:
-
t: the date for which the score should be computed. -
visit_days_ago: the number of days since the last visit to the contact, defaulting to1, which means that the last visit happened the day beforet.
Details
See the distcrete package for generating discretized
distributions at: http://github.com/reconhub/distcrete.
Examples
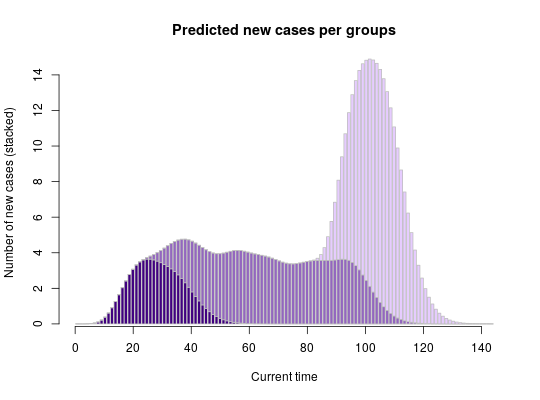
if (require(distcrete)) {
## simulate data
set.seed(1)
x <- replicate(30, sample(0:30, sample(1:5), replace = TRUE))
head(x)

 ## generate serial interval distribution
 SI <- distcrete("gamma", 1L, w = 0, 10, 0.65)$d
 plot(SI, type="h", xlim=c(0,50), xlab = "Days")
 title("Serial interval distribution")

 R <- 2.3
 lambda <- 3

 ## get scoring function
 g <- group_score(x, R, lambda, SI)
 g(c(10,20,30)) # Exp nb of new cases at t=10,20,30

 plot(g, xlim = c(0, 100), type = "h",
     main = "Expected number of new cases",
     xlab = "Current time", ylab = "Number of cases")

 set.seed(1)
 ## early wave
 x1 <- replicate(30, sample(0:20, sample(1:6), replace = TRUE))

 ## large middle wave
 x2 <- replicate(140, sample(15:70, sample(1:3), replace = TRUE))

 ## late wave
 x3 <- replicate(140, sample(65:80, sample(1:4), replace = TRUE))

 ## get scoring functions for every group
 list_g <- lapply(list(x1, x2, x3), group_score, R, lambda, SI)

 ## get predictions for days 1:120
 pred_nb_cases <- sapply(list_g, function(g) g(1:120))

 barplot(t(pred_nb_cases), col = pal1(3), border = "grey",
         main = "Predicted new cases per groups", xlab = "Current time",
         ylab = "Number of new cases (stacked)")
 axis(side=1)

}