Expected distributions of distances
These functions compute the expected distributions of distances between pairs of cases given a case reporting probability 'pi'. Analytical results are used for some special cases, including:
dpaircase(x, type = c("temporal", "genetic", "spatial", "empiric"),
  gamma_shape, gamma_rate = 1, gamma_scale = 1/gamma_rate, poisson_rate,
  sd_spatial, p, pi, alpha = 0.001)

dtemporal(x, shape, rate = 1, scale = 1/rate, pi, alpha = 0.001)

dspatial(x, sd, pi, alpha = 0.001)

dgenetic(x, gamma_shape, gamma_rate = 1, poisson_rate, pi,
  gamma_scale = 1/gamma_rate, alpha = 0.001)

dempiric(p, pi, alpha = 0.001)
Arguments
- x
- vector of quantiles.
- type
- type of distance to be considered (one of "temporal","genetic", "spatial" or "empiric").
- gamma_shape, gamma_scale
- shape and scale of the gamma distribution used for the serial interval
- gamma_rate
- an alternative way to specify the scale of the gamma distribution used for the serial interval
- poisson_rate
- rate (i.e. mean) of the poisson distribution used for the per time unit genetic mutation rate
- sd_spatial
- standard deviation of the Normal spatial kernel.
- p
- A
numericvector providing the probability mass function, or empirical frequencies, of pairwise distances. - pi
- The reporting probability, i.e. the proportion of cases of the outbreak that have been reported.
- alpha
- The probability threshold to be used to determine the maximum value of generations between two successive cases to consider; this value ('max_kappa') will be the smallest k so that p(k > max_kappa) < alpha. Defaults to 0.001.
- shape, scale
- shape and scale of the gamma distribution used for the serial interval
- rate
- an alternative way to specify the scale of the gamma distribution used for the serial interval
- sd
- standard deviation of the Normal spatial kernel.
Details
- temporal distances: the serial interval is assumed to be gamma-distributed; the procedure returns a discretized, weighted convolution of gamma distributions.
- genetic distances: assumed ... TBC
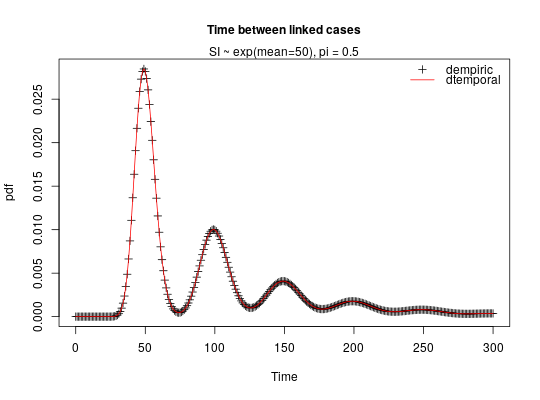
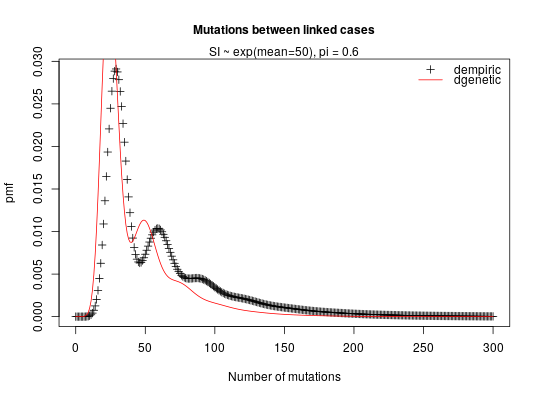
Examples
## COMPARE DEMPIRIC AND DTEMPORAL
## Note in this comparison we are not expecting to get exactly the same
## results since dempiric does the convolution between discretised gamma
## distributions whilst dtemporal does the convolution between gamma
## distributions.
## compute empirical distribution correponding to exponential(mean 50)
mean_exp <- 50
x <- 0:300
reporting_rate <- 0.5
p <- dgamma(x, shape = mean_exp, rate = 1)
## computes pdf of a gamma distr with shape mean_exp and scale = rate = 1
## (i.e. an exponential distr with mean mean_exp)
## use this as an empirical distribution to feed into dempiric
empiric_exp_distr_r50 <- dpaircase(x, type = "empiric",
                                   p = p,
                                   pi = reporting_rate)
temporal_distr_r50 <- dpaircase(x, type = "temporal",
                                gamma_shape = mean_exp,
                                gamma_rate = 1,
                                pi = reporting_rate)
## compare the two
correlation <- cor(empiric_exp_distr_r50,
                   temporal_distr_r50)
## graphical comparison
plot(x, empiric_exp_distr_r50, xlab = "Time", ylab = "pdf",
     main = "Time between linked cases",
     cex.main = 1, pch = 3)mtext("SI ~ exp(mean=50), pi = 0.5", side = 3)lines(x, temporal_distr_r50, col = "red")legend("topright", c("dempiric","dtemporal"),
       pch = c(3, -1), lwd = c(-1, 1),
       col = c("black","red"), bty = "n")## COMPARE DEMPIRIC AND DGENETIC
## compute empirical distribution correponding to
## an Exponential(mean 50)-Poisson(mean 0.6) mixture
mean_exp <- 50
mutation_rate <- 0.6
x <- 0:300
reporting_rate <- 0.5
prob <- 1-mutation_rate/(mutation_rate+1)
## pmf of a negative binomial distr with parameters size and prob
p <- dnbinom(x, size = mean_exp,prob = prob)
## use this as an empirical distribution to feed into dempiric
empiric_exp_distr_r50 <- dpaircase(x, type = "empiric",
                                   p = p, pi = reporting_rate)
genetic_distr_r50 <- dpaircase(x, type = "genetic",
                               gamma_shape = mean_exp,
                               gamma_rate = 1,
                               poisson_rate = mutation_rate,
                               pi = reporting_rate)
## compare the two
correlation <- cor(empiric_exp_distr_r50,
                   genetic_distr_r50)
## graphical comparison
plot(x, empiric_exp_distr_r50,
     xlab = "Number of mutations", ylab = "pmf",
     main = "Mutations between linked cases",
     cex.main = 1, pch = 3)mtext("SI ~ exp(mean=50), pi = 0.6", side = 3)lines(x, genetic_distr_r50, col = "red")legend("topright", c("dempiric", "dgenetic"),
       pch = c(3, -1), lwd = c(-1, 1),
       col = c("black","red"), bty = "n")