This function can be used to bootstrap incidence objects. Bootstrapping is
done by sampling with replacement the original input dates. See details for
more information on how this is implemented.
bootstrap(x, randomise_groups = FALSE)Arguments
Value
An incidence object.
Details
As original data are not stored in incidence objects, the
bootstrapping is achieved by multinomial sampling of date bins weighted by
their relative incidence.
See also
find_peak to use estimate peak date using bootstrap
Examples
if (require(outbreaks) && require(ggplot2)) { withAutoprint({
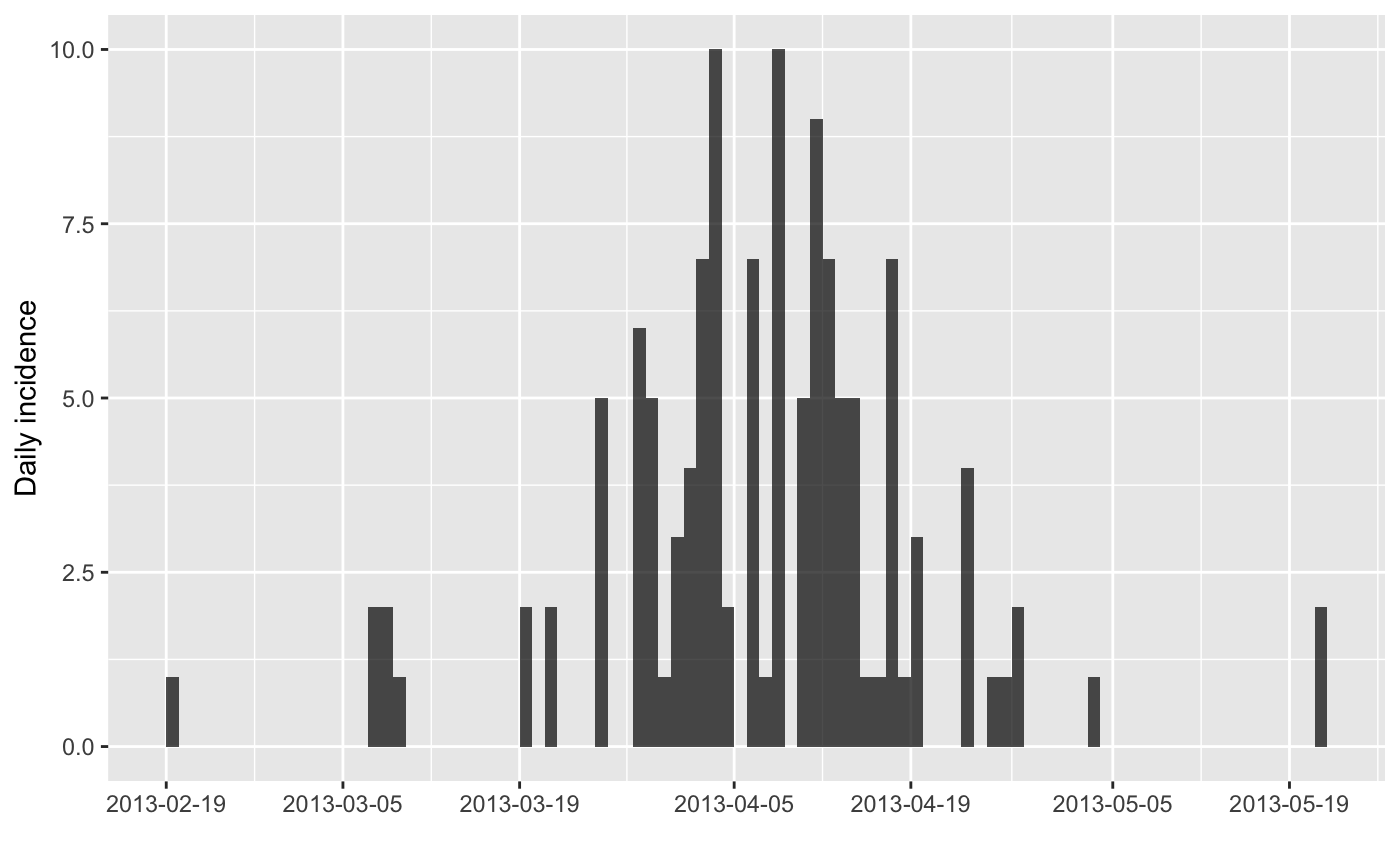
i <- incidence(fluH7N9_china_2013$date_of_onset)
i
plot(i)
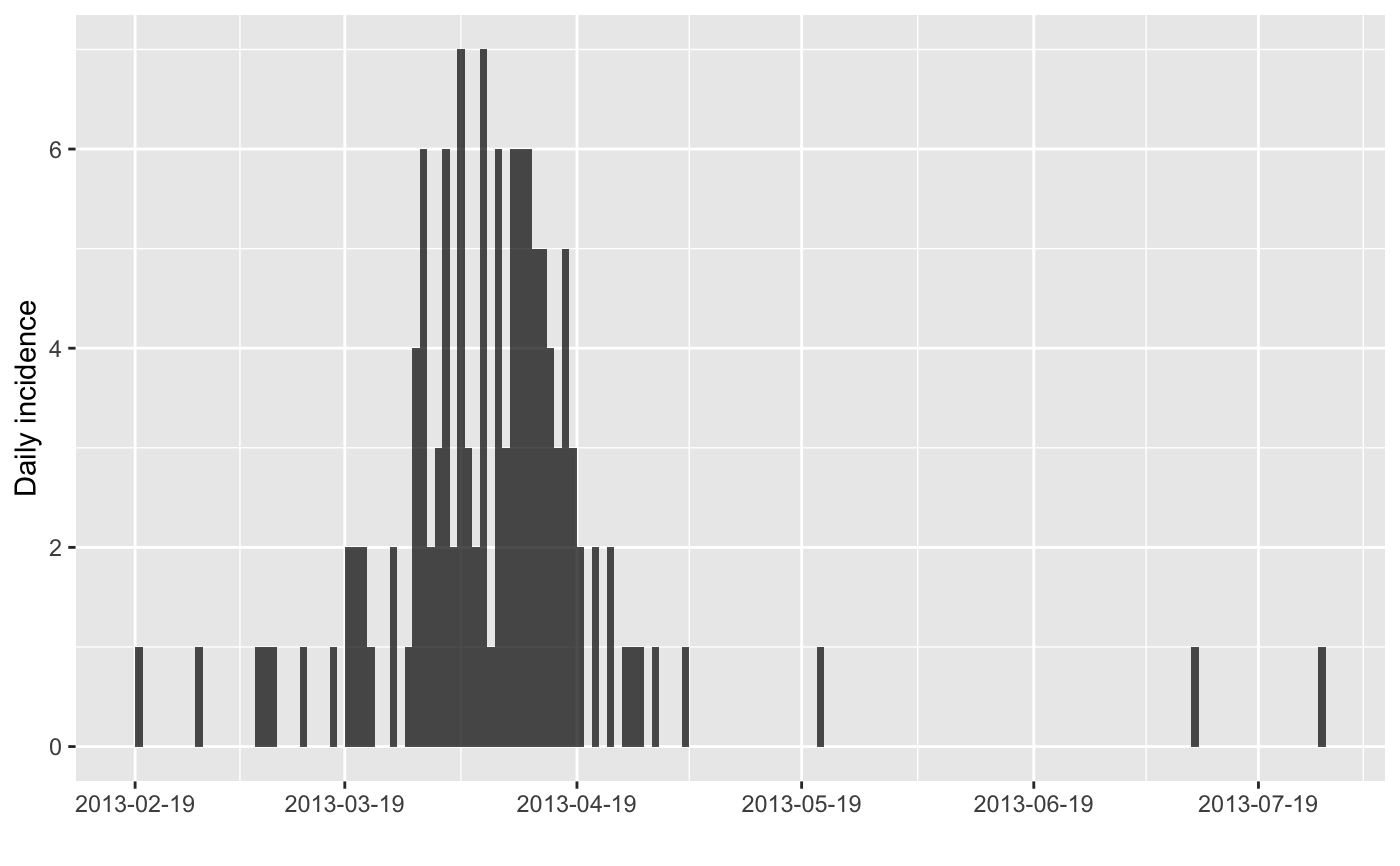
## one simple bootstrap
x <- bootstrap(i)
x
plot(x)
})}
#> Loading required package: outbreaks
#> Loading required package: ggplot2
#> > i <- incidence(fluH7N9_china_2013$date_of_onset)
#> 10 missing observations were removed.
#> > i
#> <incidence object>
#> [126 cases from days 2013-02-19 to 2013-07-27]
#>
#> $counts: matrix with 159 rows and 1 columns
#> $n: 126 cases in total
#> $dates: 159 dates marking the left-side of bins
#> $interval: 1 day
#> $timespan: 159 days
#> $cumulative: FALSE
#>
#> > plot(i)
#> Warning: `aes_string()` was deprecated in ggplot2 3.0.0.
#> ℹ Please use tidy evaluation idioms with `aes()`.
#> ℹ See also `vignette("ggplot2-in-packages")` for more information.
#> ℹ The deprecated feature was likely used in the incidence package.
#> Please report the issue at <https://github.com/reconhub/incidence/issues>.
 #> > x <- bootstrap(i)
#> > x
#> <incidence object>
#> [126 cases from days 2013-02-19 to 2013-07-27]
#>
#> $counts: matrix with 159 rows and 1 columns
#> $n: 126 cases in total
#> $dates: 159 dates marking the left-side of bins
#> $interval: 1 day
#> $timespan: 159 days
#> $cumulative: FALSE
#>
#> > plot(x)
#> > x <- bootstrap(i)
#> > x
#> <incidence object>
#> [126 cases from days 2013-02-19 to 2013-07-27]
#>
#> $counts: matrix with 159 rows and 1 columns
#> $n: 126 cases in total
#> $dates: 159 dates marking the left-side of bins
#> $interval: 1 day
#> $timespan: 159 days
#> $cumulative: FALSE
#>
#> > plot(x)