Two functions can be used to subset incidence objects. The function
subset permits to retain dates within a specified range and,
optionally, specific groups. The operator "[" can be used as for matrices,
using the syntax x[i,j] where 'i' is a subset of dates, and 'j' is a
subset of groups.
Arguments
- x
An incidence object, generated by the function
incidence().- ...
Further arguments passed to other methods (not used).
- from
The starting date; data strictly before this date are discarded.
- to
The ending date; data strictly after this date are discarded.
- groups
(optional) The groups to retained, indicated as subsets of the columns of x$counts.
- i
a subset of dates to retain
- j
a subset of groups to retain
See also
The incidence() function to generate the 'incidence'
objects.
Examples
## example using simulated dataset
if(require(outbreaks)) { withAutoprint({
onset <- ebola_sim$linelist$date_of_onset
## weekly incidence
inc <- incidence(onset, interval = 7)
inc
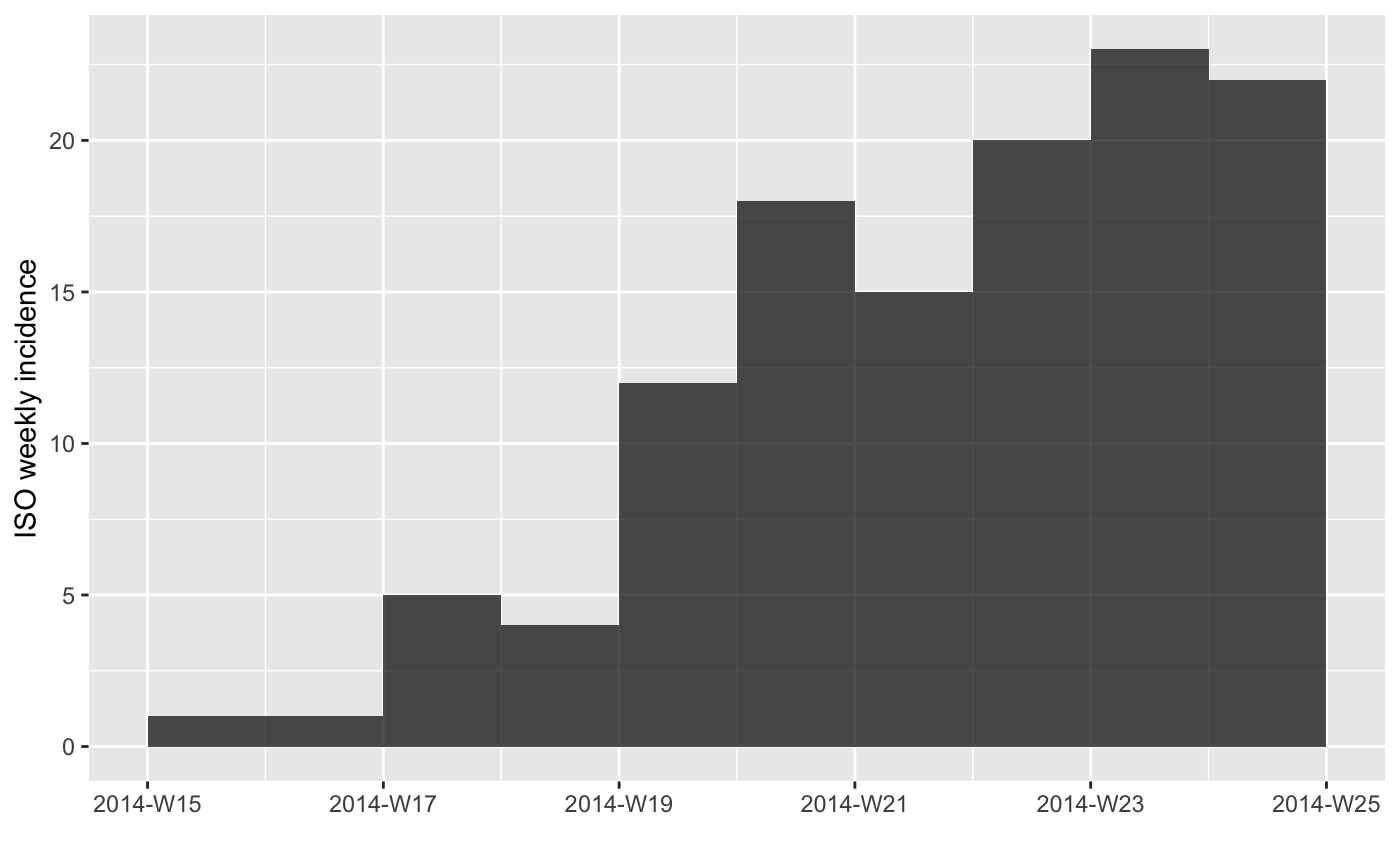
inc[1:10] # first 10 weeks
plot(inc[1:10])
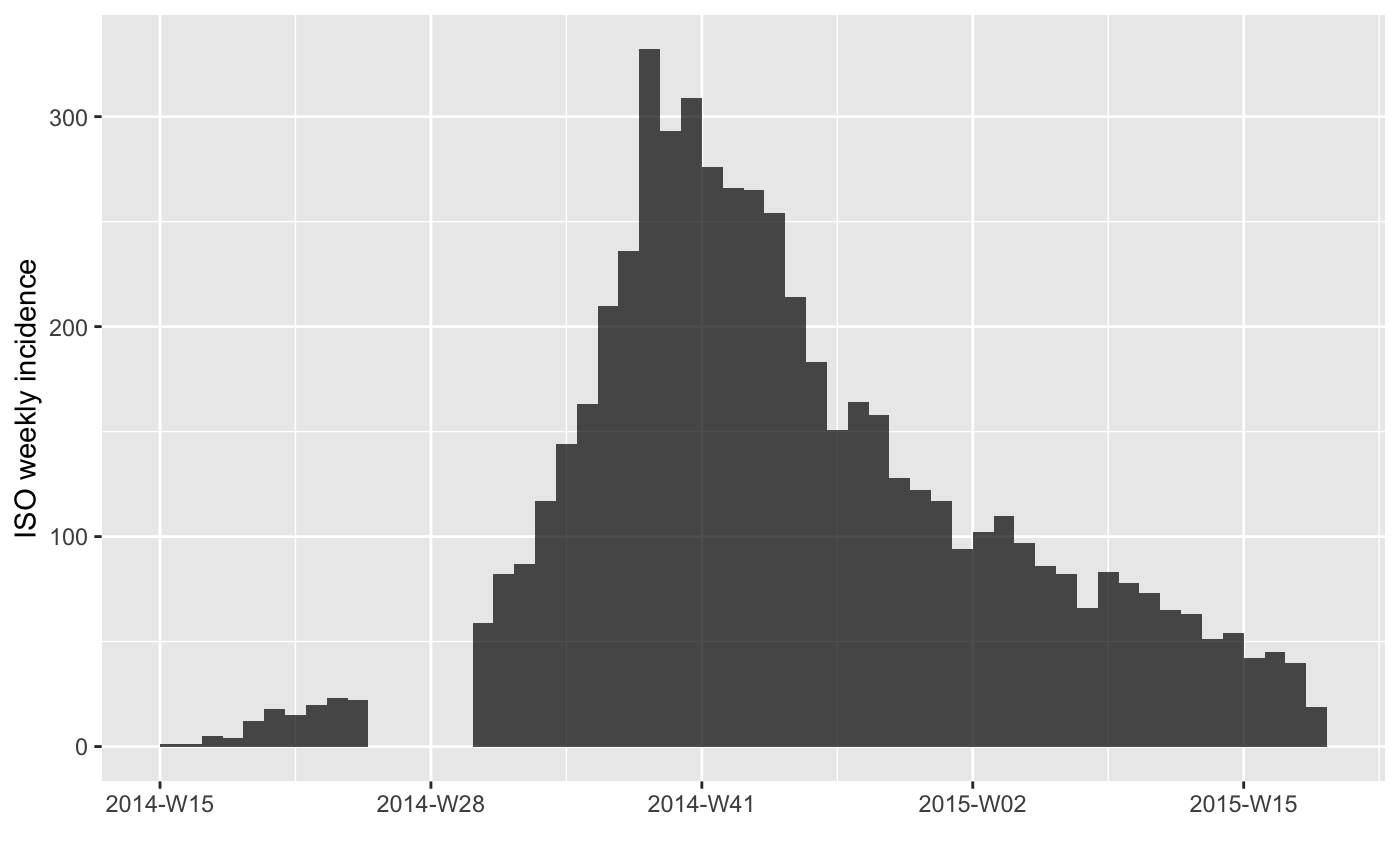
inc[-c(11:15)] # remove weeks 11-15
plot(inc[-c(11:15)])
})}
#> > onset <- ebola_sim$linelist$date_of_onset
#> > inc <- incidence(onset, interval = 7)
#> > inc
#> <incidence object>
#> [5888 cases from days 2014-04-07 to 2015-04-27]
#> [5888 cases from ISO weeks 2014-W15 to 2015-W18]
#>
#> $counts: matrix with 56 rows and 1 columns
#> $n: 5888 cases in total
#> $dates: 56 dates marking the left-side of bins
#> $interval: 7 days
#> $timespan: 386 days
#> $cumulative: FALSE
#>
#> > inc[1:10]
#> <incidence object>
#> [121 cases from days 2014-04-07 to 2014-06-09]
#> [121 cases from ISO weeks 2014-W15 to 2014-W24]
#>
#> $counts: matrix with 10 rows and 1 columns
#> $n: 121 cases in total
#> $dates: 10 dates marking the left-side of bins
#> $interval: 7 days
#> $timespan: 64 days
#> $cumulative: FALSE
#>
#> > plot(inc[1:10])
 #> > inc[-c(11:15)]
#> <incidence object>
#> [5701 cases from days 2014-04-07 to 2015-04-27]
#> [5701 cases from ISO weeks 2014-W15 to 2015-W18]
#>
#> $counts: matrix with 51 rows and 1 columns
#> $n: 5701 cases in total
#> $dates: 51 dates marking the left-side of bins
#> $interval: 7 days
#> $timespan: 386 days
#> $cumulative: FALSE
#>
#> > plot(inc[-c(11:15)])
#> > inc[-c(11:15)]
#> <incidence object>
#> [5701 cases from days 2014-04-07 to 2015-04-27]
#> [5701 cases from ISO weeks 2014-W15 to 2015-W18]
#>
#> $counts: matrix with 51 rows and 1 columns
#> $n: 5701 cases in total
#> $dates: 51 dates marking the left-side of bins
#> $interval: 7 days
#> $timespan: 386 days
#> $cumulative: FALSE
#>
#> > plot(inc[-c(11:15)])